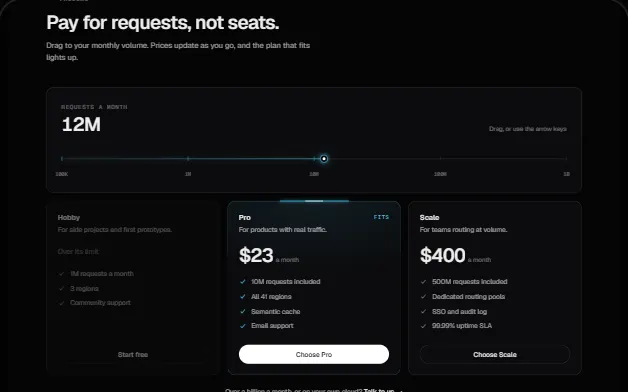
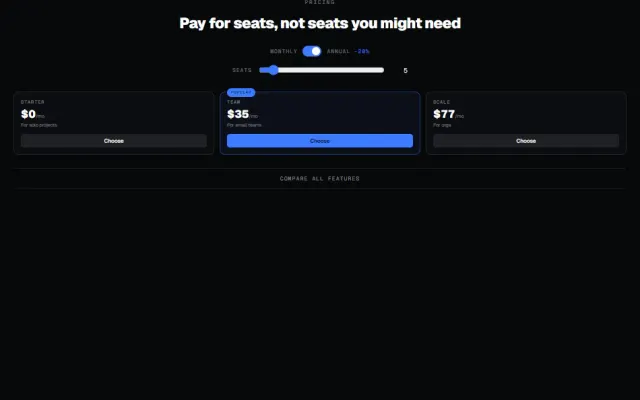
Usage Pricing Calculator
A usage-based pricing estimator: log-scale sliders with marked tier breakpoints, a total that rolls digit by digit, a stacked cost bar per line item, a sliding monthly/yearly toggle and a plan recommendation that follows your drag.
DOM + CSS0 deps1 file · 30 KB TSX
Props
"use client";

import { useEffect, useRef, useState } from "react";
import type { KeyboardEvent, PointerEvent } from "react";

/* ------------------------------------------------------------------ */
/* Pricing model                                                       */
/* ------------------------------------------------------------------ */

const BASE_FEE = 29;
const INCLUDED_REQUESTS = 10; // thousand
const INCLUDED_STORAGE = 25; // GB
const SEAT_PRICE = 12;
const ANNUAL_DISCOUNT = 0.2;

type Tier = { upTo: number; rate: number };

// Marginal tiers: each rate applies only to the slice of billable usage that

  // ---------------------------------------------------------------
  // Full source available with a viberdy Pro subscription.
  // https://viberdy.dev/pricing
  // ---------------------------------------------------------------
}
Details
About this component
Three sliders (API requests, team seats, storage) feed one marginal-tier price. Requests and storage use a logarithmic scale, so 1k and 1M both fit on one track; the value snaps to a ladder of round stops (1, 1.5, 2, 2.5, 3, 4, 5, 6, 7.5 times each power of ten) and the thumb follows the pointer continuously while it drags. The tracks are shaded in zones: the included allotment, then each rate tier, with notches at the breakpoints and the rate printed above. The overage is a real marginal walk: the free allotment is subtracted first, then each tier charges only for the slice of usage inside its own span, so crossing a boundary never reprices volume you already paid for at a higher rate. The total is a bank of digit columns; each column translates a strip of 0-9 on a 700ms ease, staggered by place value, so the figure rolls instead of swapping. Under it a stacked bar splits the bill into base, requests, seats and storage, widths animate on 520ms, and hovering a legend row dims the other segments. A Monthly/Yearly toggle slides a pill between its options; Yearly takes 20% off, fills a hatched slot at the end of the bar with the saving, and restates the yearly bill. A plan indicator picks the smallest of Starter, Team and Scale whose limits fit all three sliders and says which slider pushed you up. Props: maxRequests (thousands), maxSeats, maxStorage (GB), defaultAnnual, defaultRequests, defaultSeats, defaultStorage, onChange (called with the full estimate) and className. The figures are an estimate for display only; invoices must be computed on the server.
Curator’s note
Rebuilt in October from a two-slider card into a full estimator: log-scale sliders with the tier breakpoints drawn on the tracks, a total that rolls digit by digit and a cost bar that reshapes as you drag. One file, no dependencies.